Despite starting my PhD full-time with no other professional commitments, I was still concerned with how I would manage this wonderful time I had been given. So, as usual, I looked for a technical solution. I plumped for Rescue Time which monitored what I was doing on my devices: what websites I visited, what software I was using and for how long. More recently it also added website and application blocking to its functionality, but I was already wedded to Cold Turkey by then. I could categorise the websites and applications by ‘productivity’* (some more arbitrarily than others). The result is I now have quite a chunk of numbers about what I actually did during my PhD. There were occasional times where I read real books, worked on paper for brain dumps and for proofing in the final stages but for the most part everything was digital. (I did remove the app version from my phone because that was my main lifeline to a social life snatched in minutes here and there, and these were putting a nasty big red ‘distracting time’ bars in my graph.) Here’s how it breaks down.
First, the big wins – my most ‘very productive day’ ever, Monday 10th October 2016:
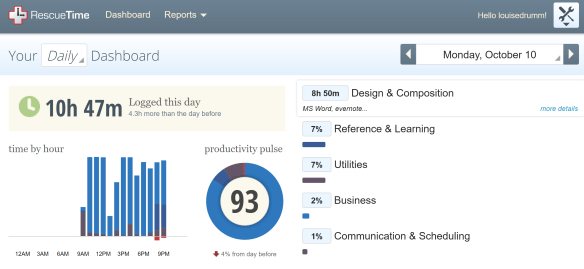
It was a long day, 9am until 10pm and, from checking the details Rescue Time recorded, I was working on one of my literature review chapters. I remember I didn’t eat any dinner that day – see no break around 6pm. This was the exception, not the norm, as the following makes clear.
The ‘productivity’ headlines:
- Year one: 798 hours total – averaging 17 hours per week of 46 weeks worked
- Year two: 648 hours total – 14 hours per week (this year included offline data collection interviews)
- Year three (changed to part-time): 631 hours total – 14 hours per week
- Year four (still part-time): 809 hours total – 17 hours per week
Before this is misunderstood to mean that it is possible to do a PhD by working less than 16 hours each week, these are the ‘most productive times’, when I was reading and writing. This accounted for 58% of the time I was sitting at a computer and should have been working, not writing emails, struggling with Windows 10’s relationship with Eduroam or browsing tents, tarpaulins and advanced knot-tying techniques (a bid for escape into the wild obviously). Also, as I mentioned in Post-PhD Reflections: Part One, I learned that, to a degree, following some distractions was OK, even necessary. However, I did use technology as much as I could to remove time-sucking temptations (which I’ll follow-up in another post updating my original My PhD Digital Toolkit post).
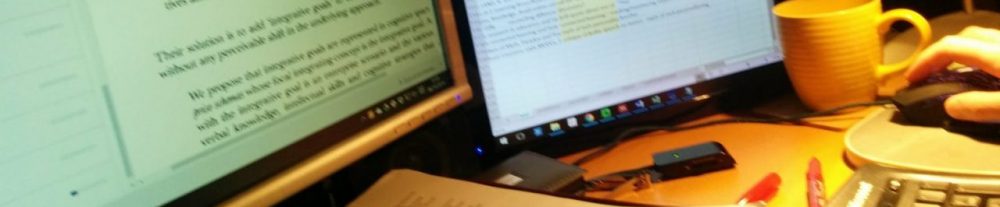
It is interesting to trace the changes in my behaviour. For example, as can be seen in the two screengrabs below, the difference in applications I used in 2014 (year 1 to 2) and 2017 (last 6 months) are apparent – I collated information and notes in Evernote in the early years and was writing in Word in the last year:

The other take-away numbers are the following for the total times for these central activities for the full PhD over 4 years:
- Time reading: 1342 hours
- Time doing analysis: 389 hours
- Time writing: 1826 hours
Meaning of all the time I had available to work I spent:
- 22% of my time reading
- 6% of my time doing analysis
- 30% of my time writing
So, not anywhere close to the ‘you should always be writing’ mantra that you can see in the PhD industry blogs. I am surprised that I spent 8% less on reading than writing. I thought I was reading too much initially and I read fairly widely, but as my writing developed, reading inevitably became more strategic. This was helped a lot by the notes I had taken in the first two years (when I felt I really didn’t know what I was doing but at least I could pretend to be meticulous).
I would regularly review the graphs of daily productivity which helped me relax and accept that my most productive times (according to Rescue Time at least), were the hour after 11am, and from 3 to 5pm. I could take a bit of time to warm-up in the morning, or perhaps I worked with more concentration closer to deadlines such as lunch and home-time. Whatever the case, I knew that I would get work done even if I wasn’t at full-steam by 9am. Or even if I had spent a full-hour faffing on Twitter by 10am, I knew the day wasn’t necessarily lost.

During the final 6 month ‘push’, I no longer needed to consult Rescue Time, nor use distraction blockers to keep me on track. I set my own deadline to submit and managed to keep to it with a couple of weeks, in spite of a family bereavement. I’m still surprised that it all came together in the end. But there were rocky patches and the first two years were the hardest for me as nailing my question, scope and theoretical framework eluded me. 14 hours productivity per full-time week in my second speaks volumes about my focus – it wasn’t enough and I knew I had to review my working patterns. (You can see why I never felt comfortable publishing these stats during my PhD – I would have been mortified for my supervisors to know!)
What the figures don’t show is that gentle, imperceptible shift from novice to expert, and from uncomfortable liminality to comfortable liminality. Nor does it show the huge effort I made at the two year point, around the same time as going part-time, to start using more of my evenings and weekends to get it done.
It is not without some naive disappointment that I am coming to the realisation that, in the coming months and years, those kind work patterns will probably be a long-term fixture in my life as I attempt to get a foot in the door of the next phase of my career.
*I categorised ‘Very productive’ as websites and applications where I was reading (Adobe acrobat/reader, Kindle, Mendeley) and writing (Evernote, Scrivener, MS Word). Evernote wasn’t purely writing as I did a lot of clipping and reading, but I’m guesstimating a trade-off between this and Acrobat as sometimes I would have been creating or editing PDFs.
